During CREtech London last October, Kevin Mattice, Cherre’s Chief Product Officer, asked, “How can an organization accurately and instantly report on asset performance?”
It seems to be a simple goal, yet many companies find themselves stuck in complex time and resource-intensive reporting processes where they still doubt the accuracy of their insights.
In this post, we outline why reporting on asset performance is not as simple as it might seem, where the main issues lie, and offer some ways to overcome these challenges.
First, let’s consider the types of data you use for reporting and then, all of the stakeholders involved that rely on the same data that powers reporting.
Depending on the use case and type of report you are looking to generate, you likely use the following types of data:
Usually, when reporting on asset performance or trying to benchmark your properties against the market, you will use a mix of these different data types.
Various teams across your entire organization all use the same data to fulfill the functions and responsibilities they are accountable for:
Teams like sales and marketing, analysts and researchers, property managers, underwriters, and lenders also have their own sets of needs and requirements. In short, you have many different stakeholders across the organization and you need to give them all access to the same data without creating silos.
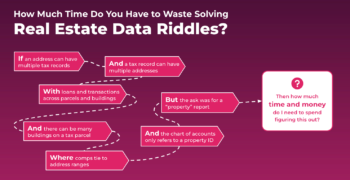
Now that you’ve considered the stakeholders and the types of reports they need, and you’ve identified the data you need to generate the report, you need to think about how you will pull all that disparate data together. Let’s say you start with all the property data you have across the different sources, and you realize that the property is not defined in the same way across data sets. The example below demonstrates how you could have two buildings on one parcel, with many different addresses associated with those buildings. This is because your data doesn’t speak the same language.
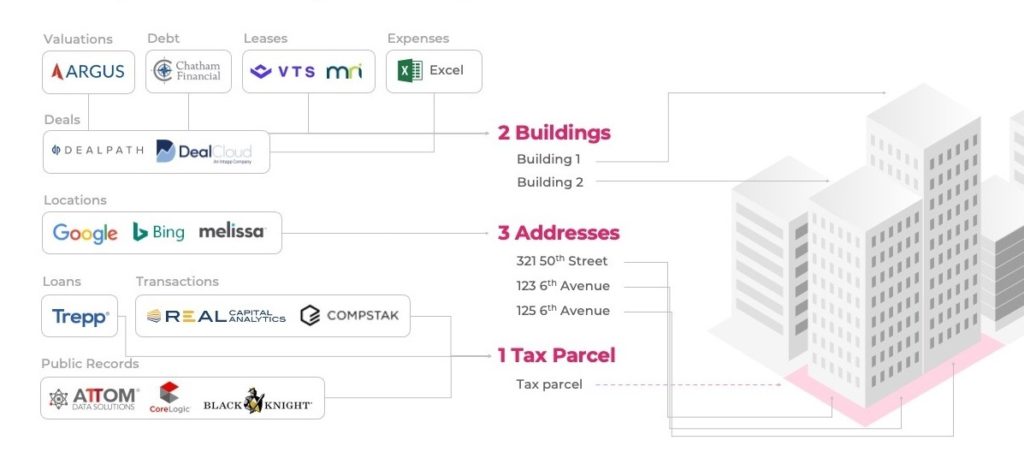
Your valuations data, your leasing data, your debt data might all tie together at the building level. Deal flow data could be about a number of buildings that are part of an investment portfolio. Transaction data, or tax assessor data will be tied to the parcel.
If you want to leverage all this data, you have to find ways to standardize the data across all the different data sets in order to connect it in a meaningful way.
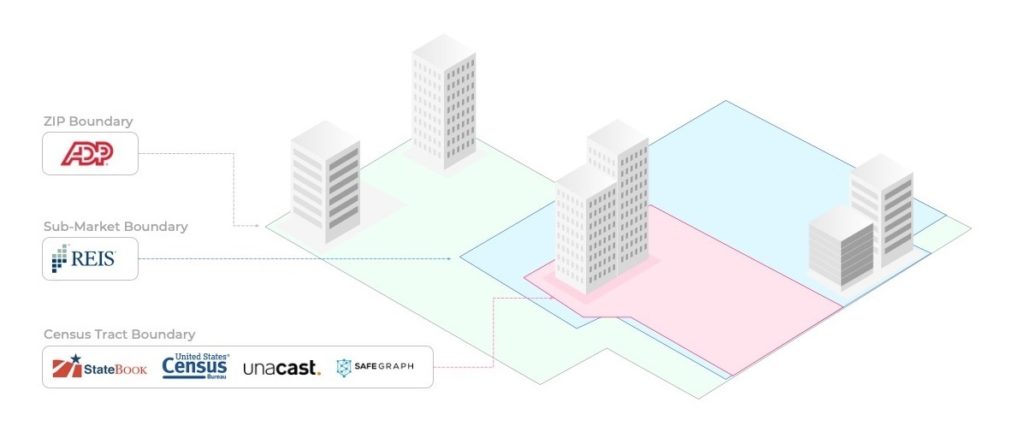
Your market data has the same problem. Some of your data will be at the market level or a submarket level. You might have your own internal market parameters based on your own research. Local government institutions that provide demographics data will also define that market or specific area as a different geography. As soon as you start trying to benchmark your data with the market data, you’re going to have a really difficult time lining it up.
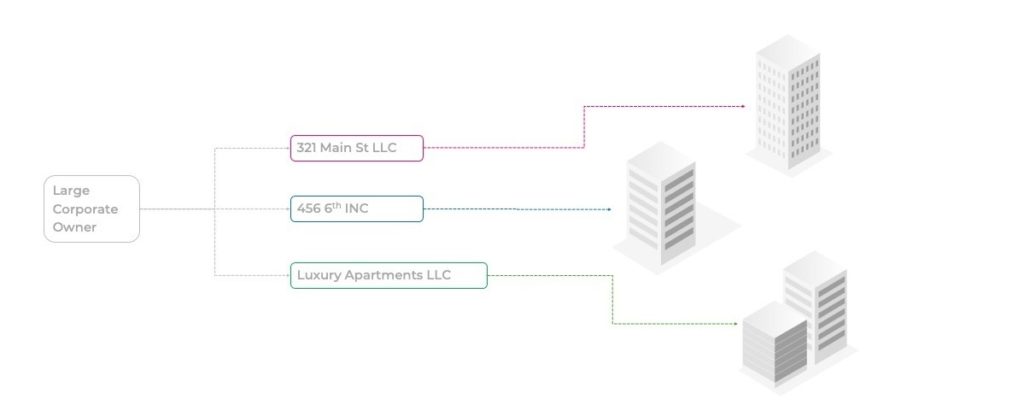
Most of the time, large corporate entities are going to buy properties under some different, very abstractly named LLCs. All of those LLCs actually roll up to one large corporation but you would never know that. If you’re trying to benchmark your portfolio against a competitor’s portfolio, there’s no easy way to identify the competitors’ assets because they are hidden behind an LLC.
So it’s pretty clear that generating a basic property report isn’t as simple as searching for “123 Main Street.” That’s because your data doesn’t speak the same language – you need to connect it in order to do the reporting and benchmarking you need to do. So what can you do?
Cherre is a data management platform that integrates all your internal, subscription, and public data into a single source of truth in order to provide you with the actionable insights you need for better, faster decision making.
The first piece of the puzzle is made easier through Cherre’s data partner network. Cherre has nearly 150 real estate data and application partners and friends that we’ve worked with to ingest their data ahead of time. We have modeled that data intelligently making it easier to connect application and subscription data from various sources into your data analytics warehouse. Additionally we make sure your data continues to flow no matter the changes at the source level, and continues to be connected within the data model.
With Cherre, your engineers don’t have to spend time building connections to 30 different API’s, getting them into a single infrastructure, and later, spend countless hours on maintaining all of them. You don’t have to spend time forming additional contracts on top of your existing ones with all of your different data and application sources. Your engineers can stay focused on the value-add work for your organization.
Cherre has built the largest Real Estate Knowledge Graph that we use as the fabric for our data connection engine. We’re one of the few companies who have a view of the entire world of real estate data in a single data model. We take all of the data we’ve ingested for you, standardize it, and use our knowledge graph to resolve entities, making it easier to connect disparate sources. Our platform knows how to handle the different ways your data is defined across different sources including parcels, buildings, addresses, polygons, etc.
We provide all your clean, mapped, and connected data back to you via a single GraphQL API. We know that your data science and engineering teams are going to spend the majority of their time managing data pipelines, and that’s a huge waste of time. With Cherre’s API, your team will be able to focus on using your connected data in the tools and solutions already in use across the organization. They won’t have to waste time on data wrangling.
Cherre’s API makes it easy to integrate your connected data directly into the BI tools of your choice. Cherre also offers it’s own analytics and reporting application, CoreExplore. CoreExplore’s out-of-the-box dashboards and reports make it easy to get up and running right away, and our “build your own custom dashboard” capabilities empower you to build the dashboards you need for your specific business.
Cherre’s solution ultimately gives you the flexibility to connect your data and use it in the way you need, specifically for your business.
Going back to the original question: “How can an organization accurately and instantly report on asset performance?” Getting all your real estate data into a single source of truth and making it available for the entire organization is the key.
If you’d like to learn more about how Cherre’s data management and analytics platform can help you gain a single view of your entire asset portfolio, accurately report and benchmark asset performance, or identify new investment opportunities, schedule a demo.
You’re barraged by real estate data sales pitches every day. Buzzwords like AI, Moneyball, or Bring-Your-Own-Data Visualization layers. But you rarely hear about implementations that drive ROI. That’s because most sales pitches are bullsh*t.

“The World As a Service: A peek into the future technology is creating.”
You won’t want to miss James Whittaker’s keynote at the inaugural Cherre Data Summit on May 19 in NYC: “The World As a Service: A peek into the future technology is creating.”

14 reasons your data project has failed (including reasons you’ve never heard before)
By Raj Bhatti, SVP Client Solutions
Twenty-five years ago was the first time I heard a senior business leader say,