
Building an effective knowledge graph requires a combination of technical skills (data science and data engineering) and domain knowledge. These skills are especially important when trying to build a knowledge graph for commercial real estate data as it has many unique challenges to construct.
During his presentation this week at the NYC Data Council, Senior Data Scientist John Maiden shared some of the data science and data engineering challenges that Cherre has encountered along the way. But first, he cleared up an important question – just what IS a knowledge graph?
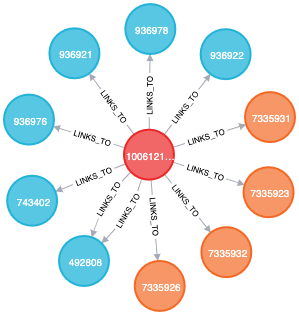
In its simplest form, a knowledge graph is just that – a way of storing data as a relationship between two entities, compared to a traditional knowledge base. It’s easier to visualize, it’s traversable, and relationships are a core component that can be analyzed and measured. It’s also straightforward to add new connections.
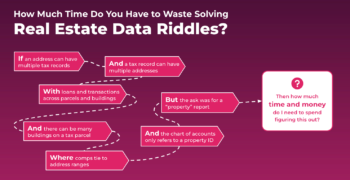
Knowledge graphs are only as good as the questions that drive them. For example, we use knowledge graphs of available CRE data to answer questions like:
We’re also working on analyzing questions like:
But here’s the challenge, and where the data science and data engineering come in, this is what the New York City graph looks like:
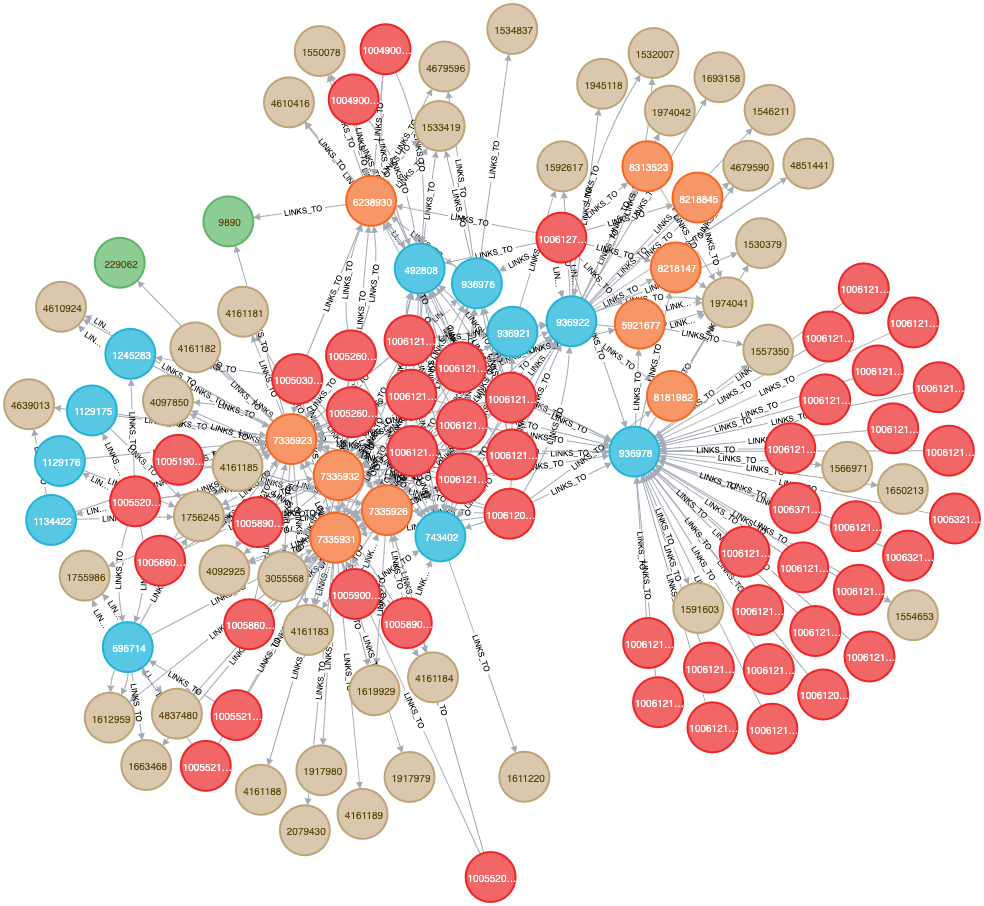
The NYC graph alone has millions of edges and nodes!
All data gets equal weight in a knowledge graph – nodes can be properties, people, corporations, or even contact information. Adding complexity is the fact that addresses and names (people and corporations) can come in different formats with spelling variations or typos. There’s also a need to disambiguate common names.
We do a lot to programmatically standardize the data (names, addresses, and many other objects), which helps us build a more ideal knowledge graph:
When it comes to standardization, here are some of the key lessons we learned:
If you’re interested in learning more about Cherre’s Knowledge Graph and how we use it to model the real estate ecosystem, watch this presentation by Dr. Ron Bekkerman, Cherre’s CTO, from the Knowledge Graph Conference in May 2020.
You’re barraged by real estate data sales pitches every day. Buzzwords like AI, Moneyball, or Bring-Your-Own-Data Visualization layers. But you rarely hear about implementations that drive ROI. That’s because most sales pitches are bullsh*t.

“The World As a Service: A peek into the future technology is creating.”
You won’t want to miss James Whittaker’s keynote at the inaugural Cherre Data Summit on May 19 in NYC: “The World As a Service: A peek into the future technology is creating.”

14 reasons your data project has failed (including reasons you’ve never heard before)
By Raj Bhatti, SVP Client Solutions
Twenty-five years ago was the first time I heard a senior business leader say,