You may have heard us talk about Cherre’s real estate knowledge graph. But what is a knowledge graph, and why is it important?
To begin, we’ll define a graph, and then talk about different categories of graphs – the knowledge graph being one of them. We’ll explain what knowledge graphs are in particular and briefly describe Cherre’s knowledge graph.
What is a graph?
A graph is a mathematical structure used to model entities and their relationships. Graphs are made up of nodes and edges. Nodes, also called vertices or points, represent the entities for which we are finding the relationships. Edges, also called links, connect two nodes when a relationship exists between them.
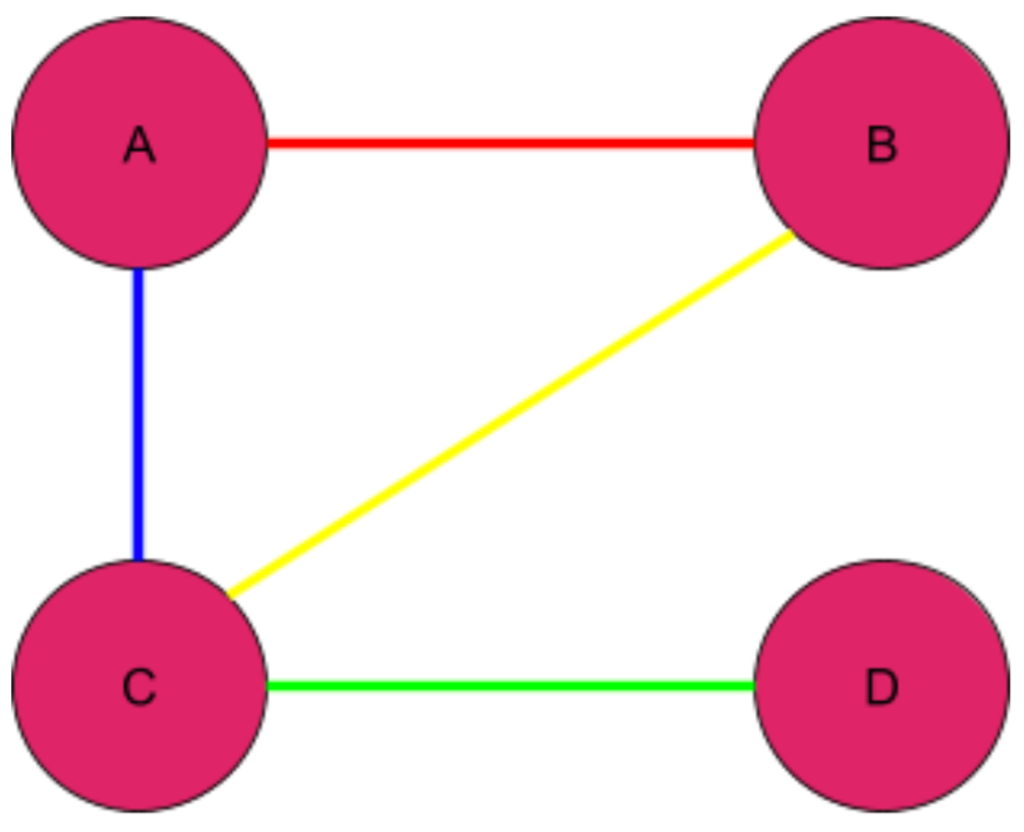
As an example, let’s look at the graph below. The graph has nodes A, B, C, and D. There are edges connecting A&B, A&C, B&C, and C&D.
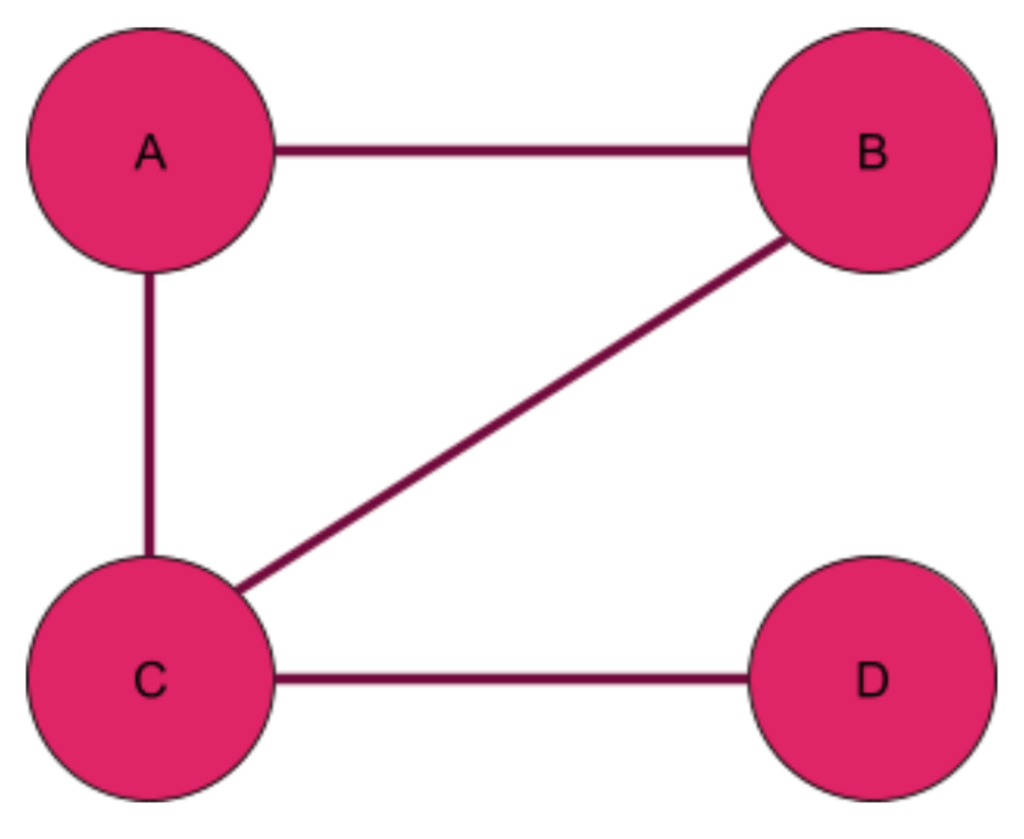
The nodes and edges in the graph can represent anything we want them to. For example, a graph of social media users would have nodes corresponding to users, and an edge between nodes would mean that those users are “friends.” A graph representing the World Wide Web would have webpages as nodes and edges corresponding to hyperlinks between pages.
Now that we have explained what graphs are, let’s talk about some ways of classifying them.
Undirected vs Directed graphs
Graphs can be undirected or directed.
In an undirected graph, the edges in the graph represent a two-sided relationship, where the relationship going from the first node to the second is the same as the relationship going between the second node and the first. For example, let’s say our graph is of LinkedIn users. An undirected graph would represent users who have “connected” with each other – this is a reciprocal relationship.
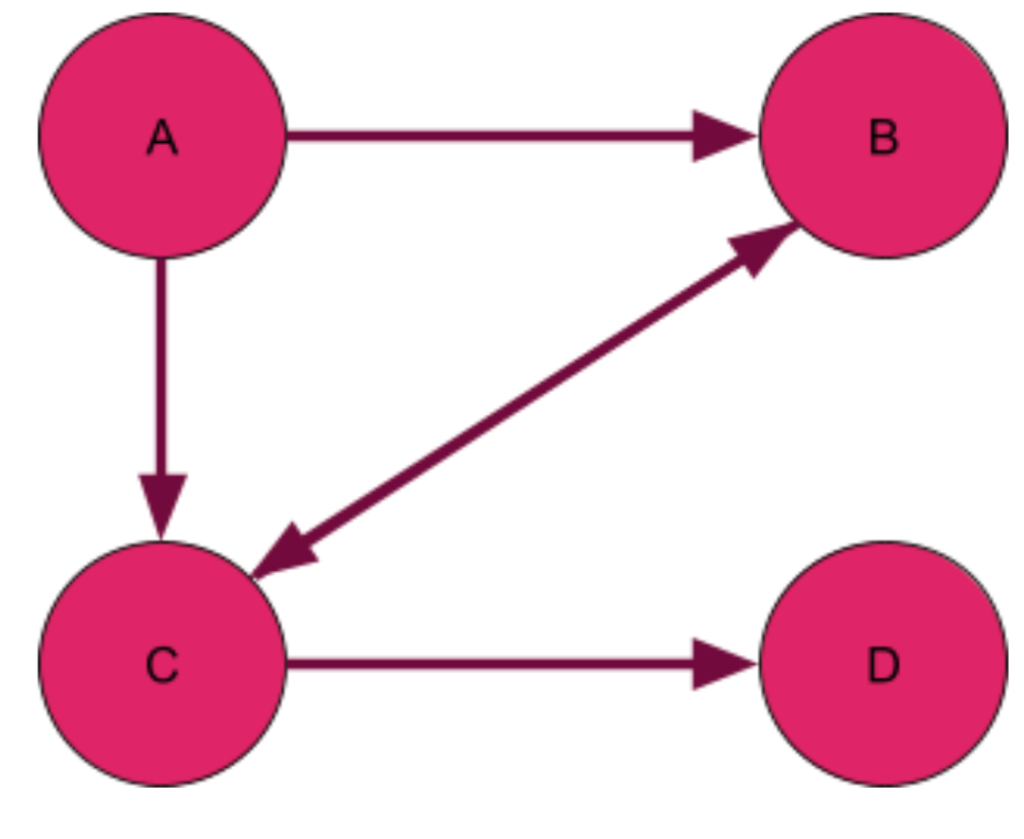
In a directed graph, the edges have a direction. The relationship from A -> B is not necessarily the same as the relationship from B -> A. In Twitter, for example, a directed edge would represent a “follower” relationship – I may follow you, but you might not follow me back. Below is a diagram of what a directed graph would look like. Instead of representing the edges by lines, we represent them by arrows that give the direction of the relationship.
Unweighted vs Weighted Graphs
Another way of classifying graphs is by whether they are unweighted or weighted. In an unweighted graph, all edges have the same weight. In a weighted graph, each edge is associated with a number representing its weight.
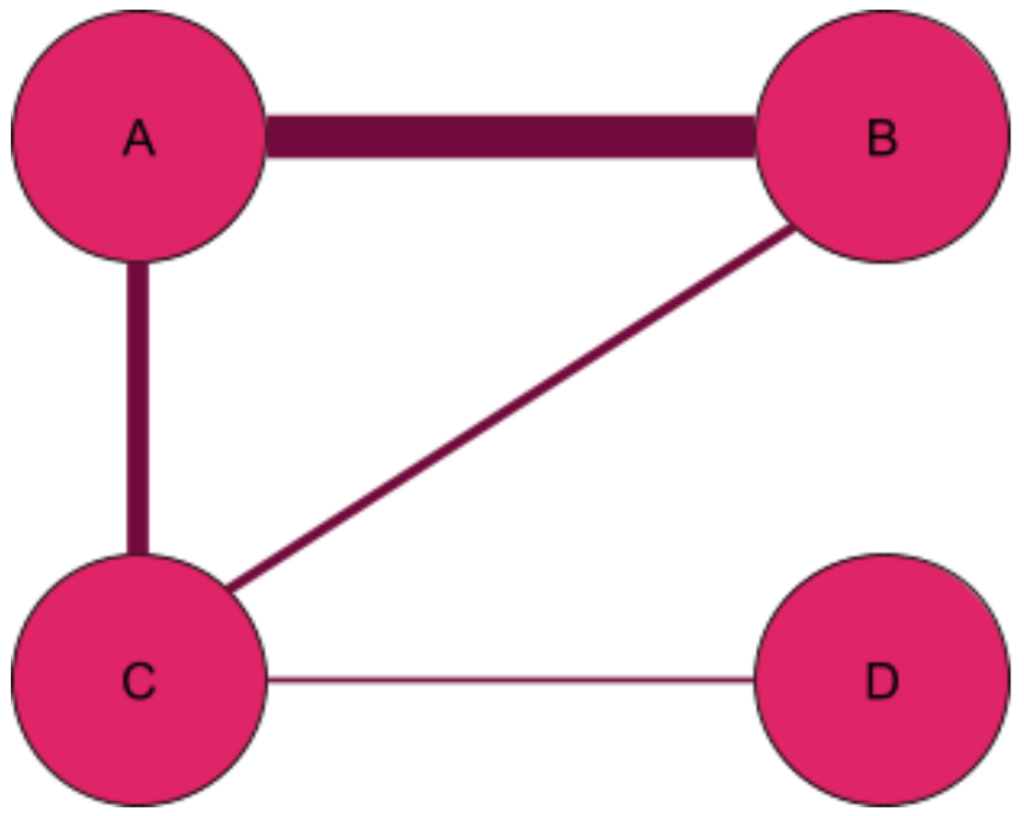
In a social network, the weights might correspond to the strength of a connection: The higher the weight, the stronger the connection between the nodes. You may have a stronger connection with your teammate, but a weaker connection with a person you met at a conference. In a graph of roads and intersections, the weight might represent a road’s capacity. Below is a diagram of a weighted graph, where a thicker line represents an edge with a larger weight.
Homogeneous vs Heterogeneous Graphs
The graphs we have discussed so far have been examples of homogeneous graphs. In homogeneous graphs, all nodes have the same type, as do all edges. For example, in a typical social network, all nodes have the same type (they all represent people), and we do not distinguish between types of friendships.
There are also graphs which are heterogeneous in nature. In a heterogeneous graph, nodes can be of different types, and there can be different types of edges between them. For example, let’s take a graph of the employees of a company. We could have one type of edge corresponding to when employees are teammates, and another type of edge corresponding to when employees are managers/direct reports. In the diagram below, we distinguish between different types of edges by using different colors.
Knowledge Graphs
So what is a knowledge graph, and why are they important?
If we simplify the definition of knowledge to a collection of facts, then knowledge about a given domain can be well represented by a heterogeneous graph. Many facts can be written in the form of two entities involved in some type of a relationship. For example, the fact that Angelina Jolie and Brad Pitt used to be married can be represented as two nodes (one for Angelina Jolie, and another for Brad Pitt) connected with an edge.
Edges and nodes can also have features which encode even more information about the relationship. For example, features of the edge between Angelina Jolie and Brad Pitt would include its type (“married”), the timestamp of the start of the relationship, and the timestamp of its end.
If we connect the node representing Angelina Jolie with a node representing her father Jon Voight, we could use the resulting graph to infer that Brad Pitt was Jon Voight’s son-in-law. Thus, by traversing the graph, we make conclusions which are not directly represented as edges connecting nodes.
This is the power of a knowledge graph: this collection of connected relationships, events, and entities puts data into context and provides a framework for use.
A knowledge graph with many (millions of) nodes and their relationships can represent an entire branch of knowledge, such as knowledge about the film industry – or knowledge about real estate.
Cherre’s real estate knowledge graph
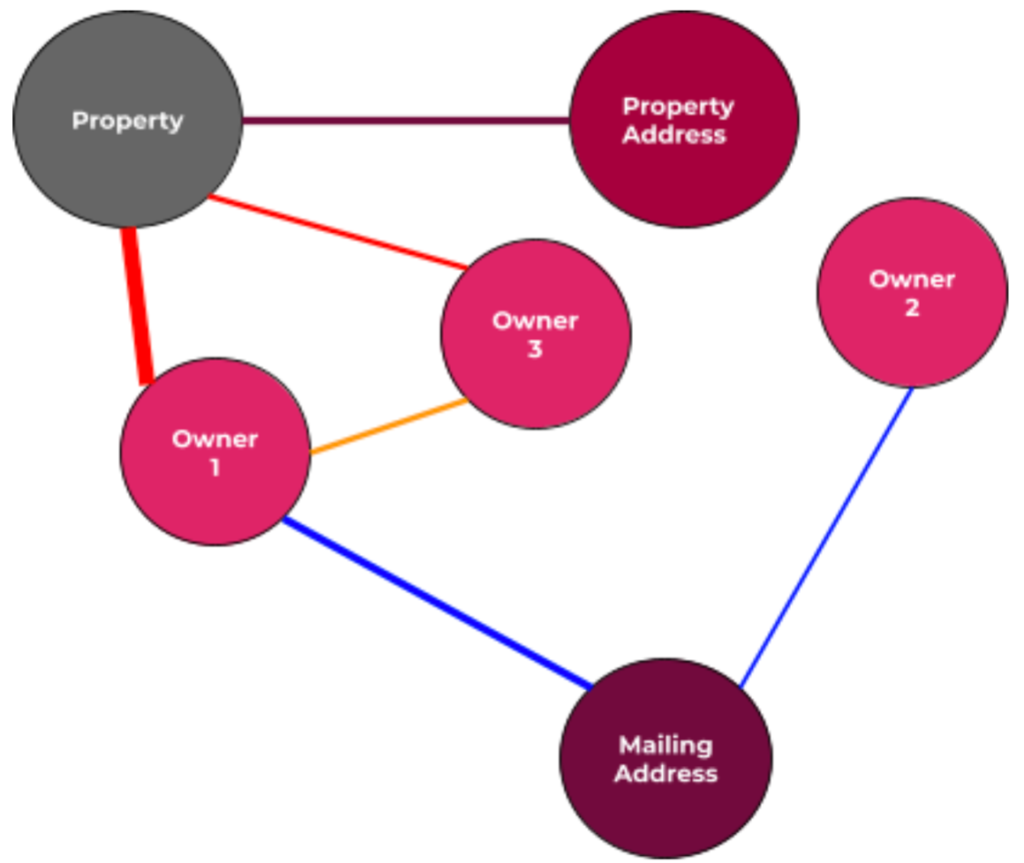
In Cherre’s real estate knowledge graph, node types are properties and addresses, as well as people, companies, governmental organizations, and educational institutions involved in the real estate market.
An edge between a property and an address indicates that the property is located at that address. Note that there might be multiple properties associated with the same address, and multiple addresses associated with the same property. An edge between a property and a person would mean that the person owns the property. An edge between an address and a person would mean that the person receives mail at that address.
The edges in our knowledge graph can also have weights, based on how many times we see the connection in our data sources. These different characteristics of our graph are illustrated in the diagram below.
The nodes and edges for our knowledge graph both have features. For nodes representing owners, for example, features would include the name of the owner that the node represents and the state in which the owner is located. Features on our edges include the source in which the connection between the entities was established and the timestamps of the first and most recent occurrences of the connection.
Cherre is intimately familiar with the power of knowledge graphs: we have built the largest real estate knowledge graph in the world. And this knowledge graph powers our Owner Unmasking feature, enabling investors to uncover true property owners and associated portfolios.
With Owner Unmasking, investors can search by any asset class or locality (even down to a small radius around a property of interest), leveraging that information to find and directly reach property and portfolio decision makers.
As Cherre ingests more and more real estate data, our knowledge graph continues to grow, and we will continue to grow its use into new applications and tools for our customers.
You’re barraged by real estate data sales pitches every day. Buzzwords like AI, Moneyball, or Bring-Your-Own-Data Visualization layers. But you rarely hear about implementations that drive ROI. That’s because most sales pitches are bullsh*t.

“The World As a Service: A peek into the future technology is creating.”
You won’t want to miss James Whittaker’s keynote at the inaugural Cherre Data Summit on May 19 in NYC: “The World As a Service: A peek into the future technology is creating.”

14 reasons your data project has failed (including reasons you’ve never heard before)
By Raj Bhatti, SVP Client Solutions
Twenty-five years ago was the first time I heard a senior business leader say,