Home flippers have always constituted a sizable segment of the single family residential (SFR) market. Although their activity has waxed and waned based on the economic backdrop, mom and pop-style flippers have been cemented in U.S. culture with shows like “Flip or Flop” and “Flip This House.”
Less well-known to most Americans are institutional investors and iBuyers, and their activity in the U.S. housing market.
Institutional investors have been reducing their overall engagement in the SFR market since 2019, likely due to the ongoing housing shortage and pandemic. But despite this overall decrease, the portion of flips performed by institutional investors and iBuyers has been increasing since 2000 – growing to a massive force in the SFR flipping market over the last five years.
Powered by our Data Kit for SFR, Cherre is taking a deep dive into the trends, history, and data around private flippers, institutional investors, and iBuyers in the SFR market. We also discuss the interesting synergies and partnerships we could see develop between institutional investors and flippers, as well as the future of iBuyers.
Our owner unmasking algorithm allows us to examine data regarding public transactions and classify them as performed by a private investor/individual or an institution. In this article, institutional investors are defined as companies of various sizes. (By that we mean the investor is not a private person, lender, bank, government entity, trust, or education entity such as a university).
With that framework, let’s take a step back and look at overall private versus institutional activity (not just flips) in the SFR space over the last few decades:
Figure 1: Estimated number of transactions for institutional and private investors in the United States since 2001. Graph powered by Cherre Data Kit tables and Cherre’s house classification algorithm.
We define a flip as a transaction where a home was bought and sold by an investor (either private or institution) within 365 days.
Our historical analysis of the number of flips per year shows an increasing trend for both private and institutional investors until 2019, when institutional investors began pivoting to build-to-rent communities.
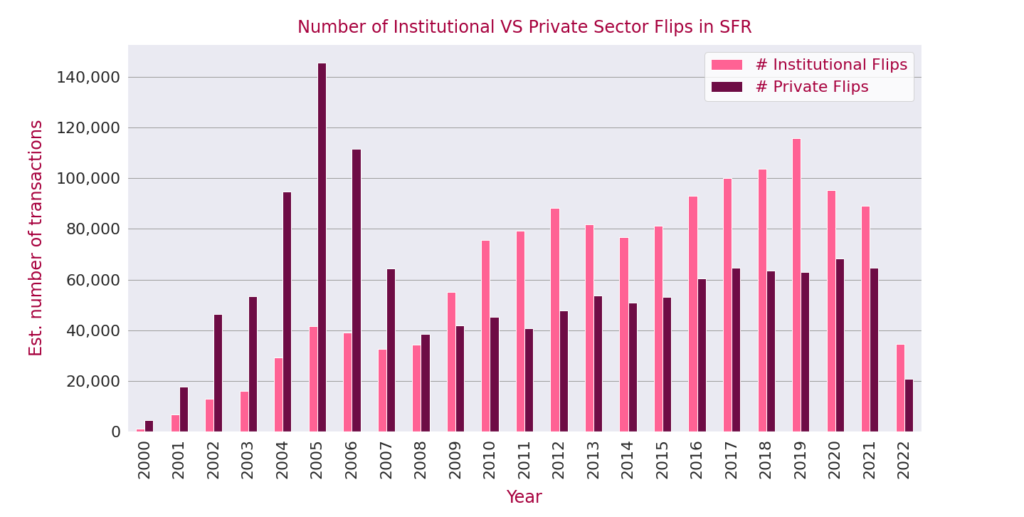
Figure 2: Estimated number of flip transactions for institutional and private investors since 2001. Graph powered by Cherre Data Kit tables and Cherre Owner Unmasking.
(See that peak in 2005? That’s the year that the first home flipping show, “Flip This House,” began airing. Art imitating life.)
Despite the decreasing number of fix-and-flips transactions by institutional investors since 2019, the ratio of fix-and-flips to overall transactions has been steadily rising. In fact the percentage of institutional fix-and-flips in 2022 (to date) has been the highest in the last 20 years. High fix-and-flip activity is typical in a market with high demand, low supply and quickly rising prices, as Rick Sharga, EVP of Market Intelligence at ATTOM, recently discussed.
Check out the ratio of flips to overall number of transactions for private and institutional investors in Figure 3:
Figure 3: Ratio of institutional flips vs. private flips. Institutional flips ratio = num_institutional_flips / num_institutional_transactions. Private flips ratio = num_private_flips / num_private_transactions. Graph powered by Cherre Data Kit tables and Cherre Owner Unmasking.
While the percentage of private flips has remained about 2 percent since 2008, the percentage of institutional flips skyrocketed since 2009 – with a significant jump in 2019 from 10.4 percent to 13.3 percent, surpassing 14 percent in 2021.
In a traditional flip model (ala “Flip This House”), the flipper maximizes profit by buying low and selling high. Many traditional flippers target distressed properties and perform major renovations so the house can be resold at a much higher price. Traditional flippers are typically constrained by capital and time – they can flip only a limited number of houses in a year.
iBuyers are companies that leverage technology to determine which houses to target. In contrast to many traditional flippers, an iBuyer seeks homes in good condition and makes cash offers based on an automated market value. The iBuyer needs to perform only minor repairs and capitalizes on market conditions to generate a small profit.
iBuyers profit due to their ability to transact at large volumes with quick turn-through. iBuyers are not as affected by supply chain issues as traditional flippers and can perform thousands of transactions in a year.
Gross ROI for top flippers
We can benchmark institutional flippers through Gross Return on Investment (Gross ROI), which is the sales price divided by the buy price without taking into account the cost of renovation.
Figure 4 visualizes median buy price versus median Gross-ROI for the top flippers in 2021 to May 2022). The four largest flippers are iBuyers: Opendoor, Offerpad, RedfinNow, and Zillow. (As we’ll see better visualized below, Zillow stopped buying houses in 2021 and is now only selling its remaining inventory.)
Other institutional buyers are also aggregated into bubbles based on their buy price and gross ROI range. The size of the bubble is proportional to the quantity of flips.
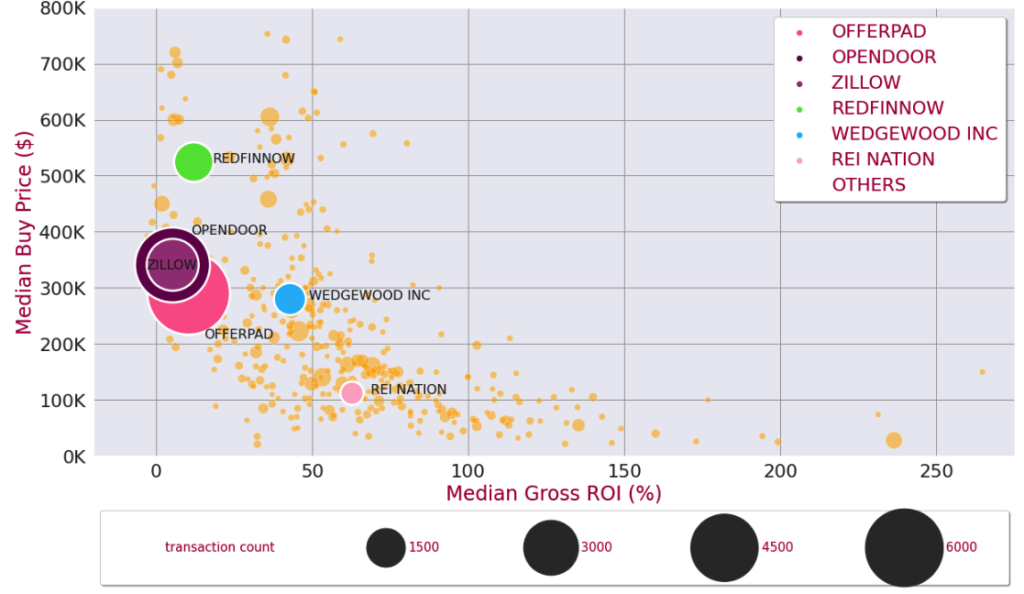
Figure 4: Median buy price vs. median Gross ROI for top flippers for 2021-2022. Graph powered by Cherre Data Kit tables and Cherre Owner Unmasking.
iBuyers operate in a relatively low Gross-ROI range (around 5-10 percent) and rely on a large number of transactions (as represented by the bubble size), as compared to other institutional flippers like Wedgewood Inc. and REI Nation.
Since 2017, the iBuyer section of the pie has grown to about 50 percent in 2019 and 63 percent in 2022. Figure 5 shows the evolving distribution of flips transactions between the top six flippers and other institutional investors.
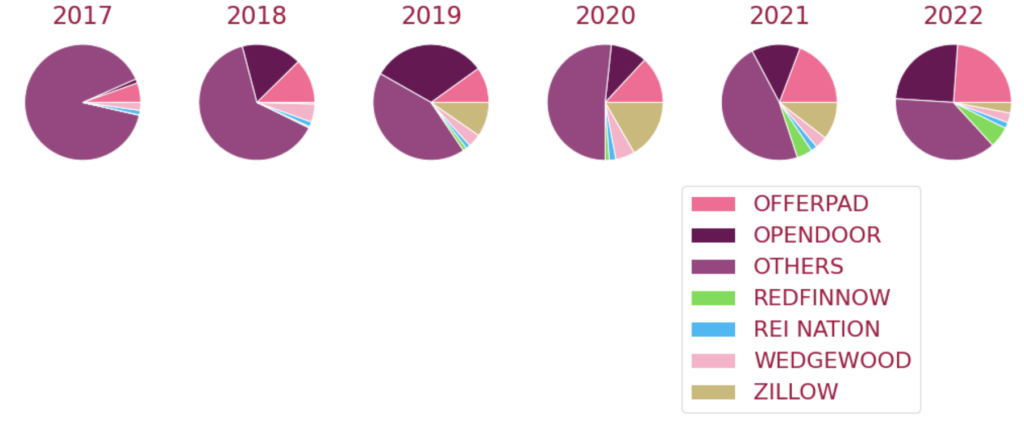
Figure 5: Distribution of transactions between current top flippers since 2017. Graph powered by Cherre Data Kit tables and Cherre Owner Unmasking.
Investors have their own unique investment criteria, which leads to them targeting different markets and submarkets – including some unexpected ones.
Investors using a tool like Cherre’s Data Kits for SFR are empowered to mine top flipper activity per market, investigating whether activity is due to supply constraints, capital considerations, or other factors.
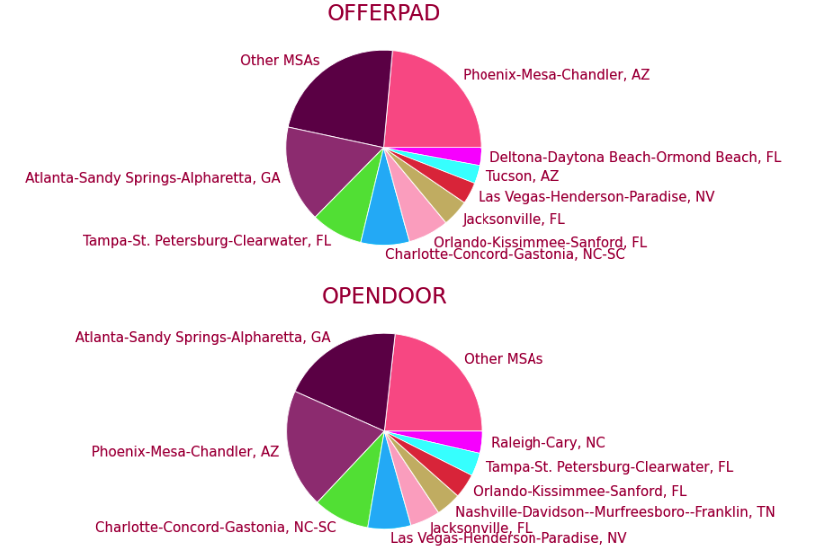
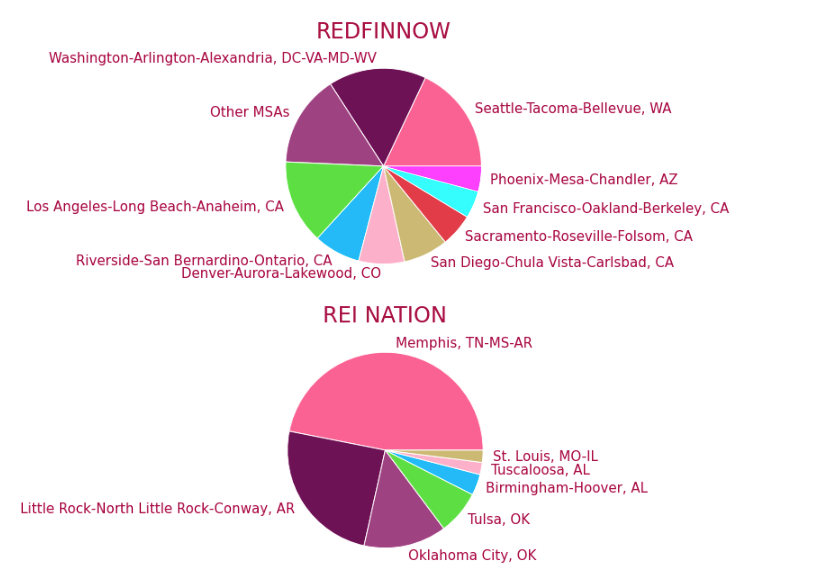
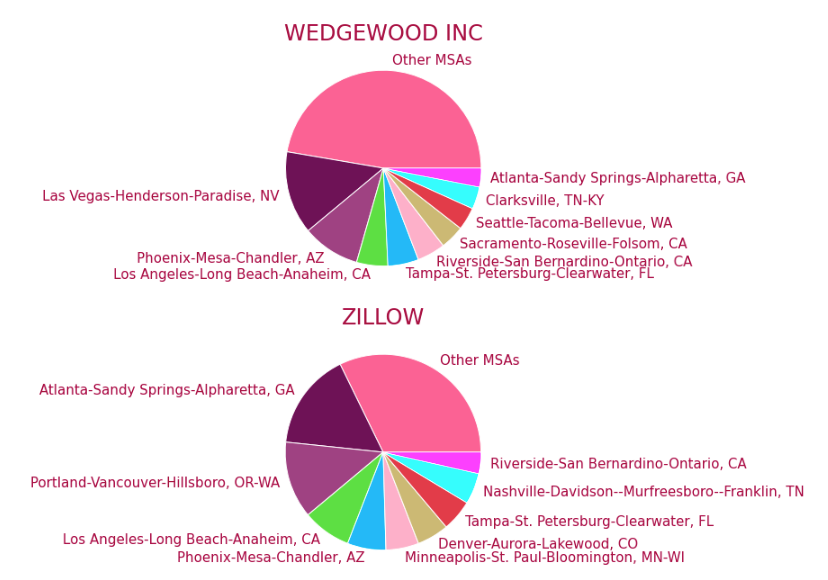
Figure 6: Top flipper activities at the MSA level. Graphs powered by Cherre Data Kit tables and Cherre Owner Unmasking.
Two common strategies for institutional investors are Build to Rent and Buy to Rent. Given the depth of the nation’s housing shortage, as well as the growing number of households renting due to the lower cost to rent versus owning a home, we anticipate that institutional investors will continue to deploy capital in the rental SFR space despite rising interest rates (most large institutional investors do not need to rely on a mortgage for financing).
(Extra credit reading: Institutional investors are unaffected by rising rates, as they draw their capital through investment funds and not mortgages.)
Traditional flippers may be a good source of inventory for Buy to Rent investors:
With the rapidly evolving SFR market, iBuyers will need to adapt to conditions previously unseen or not previously factored into their AI-powered automated valuation model algorithms.
For example, first-time homebuyers with growing families and growing incomes will always exist no matter the market cycle. Savvy iBuyers could follow migration patterns and target great school districts with high-growth employment markets in pursuit of these first-time homebuyers. (Cherre’s Data Kits for SFR are a great resource for this type of research.)
Median home prices in some markets will continue to rise while others might experience a drawback. iBuyers have a much smaller profit margin than a traditional flipper, which leaves little room for error. If their iBuying algorithms cannot maintain the current profit margins, iBuyers might be headed for difficult times.
iBuyers rely on a large volume of transactions to offset the lower profit per transaction. As housing sales cool with private buyers likely to decrease exposure, will iBuyers be able to maintain their sales volume? Would iBuyers start selling more to Buy to Rent investors? Or alternatively adopt a Buy to Rent strategy rather than a flip strategy? (This last option seems likely to us.)
Powering insights in the new market cycle
Data can be the differentiator for institutional investors, large flippers, and iBuyers, allowing them to pivot their strategies to remain competitive in the new market cycle. All the data and insights in this article are powered by Cherre’s Data Kits for SFR and Owner/Portfolio unmasking tools, which can help firms locate new flipping partners, markets to target, and data sources to refine their evolving algorithms.
For more information about how Cherre can help you confidently prepare for the next market cycle, give us a shout – we’re happy to share what we know about market trends, datasets and data ingestion, integration, and insight tools.

We’re incredibly excited to announce that Cherre has joined RealPage.
Together, we’ll continue the same journey we started almost a decade ago at Cherre,

Combination connects property-level operations with institutional portfolio intelligence, giving owners and operators a governed, trusted foundation for better decisions and stronger performance
RICHARDSON,
For two decades, competitive advantage in institutional real estate ran on two rails: who you knew, and what your data stack could do.